Services
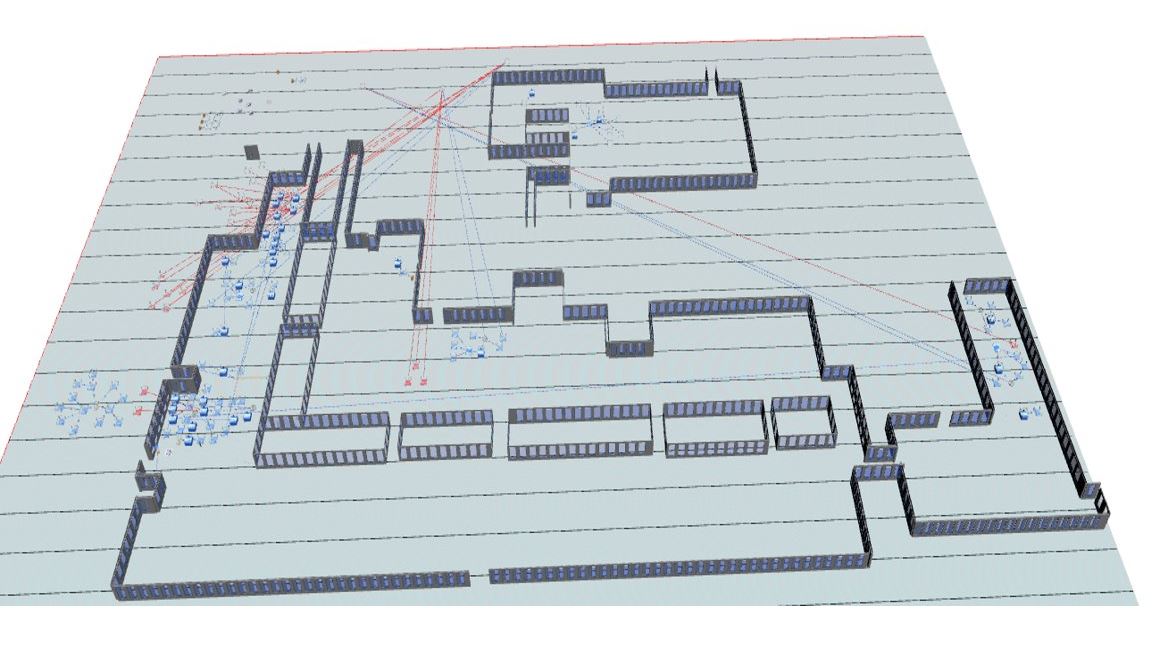
Plant Simualtion
Model, simulate, visualize and analyze production systems and logistics processes to optimize material

Optimize My Plant
Provides production managers with on-demand access to production simulation for daily, weekly, &monthly forecasts
Optimize My Plant KPIs

Total Throughput
Users can easily monitor the production lines station and total throughput by selecting the daily, weekly or monthly time period. This feature allows you to keep a close eye on the production progress and make necessary adjustments to ensure maximum efficiency.
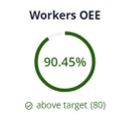
Worker OEE
To improve productivity, you can view the worker OEE either as a whole or by selecting a specific worker. By doing so, you can identify workers who may have less work to do and move them to stations where there is more work that needs to be completed. This will help to optimize the production process and increase efficiency.
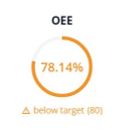
Equipment OEE
To optimize the production process and increase efficiency, it's important to take a look at the equipment OEE as a whole and by station. By doing so, you can identify stations with a higher equipment OEE and move workers to those stations to ensure that they are being utilized to their full potential. This will help to improve productivity and ensure that all equipment is being used effectively.

WIP Distribution
At each station, we have graphed the Work in Process (WIP) to monitor how much work is currently being processed. Additionally, we display the total WIP in the system as a higher level KPI. This allows us to easily track the amount of work being done and identify any areas where improvements can be made to increase efficiency.
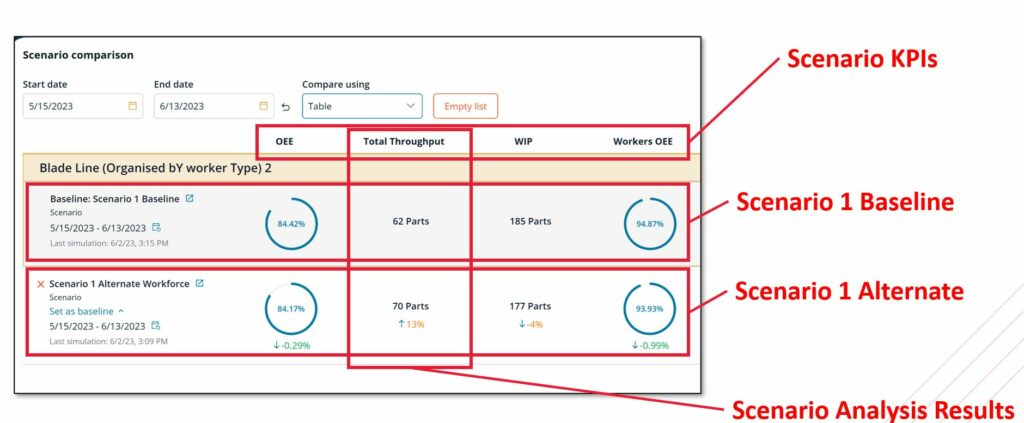
Optimize My Plant Comparison Tool
The comparison tool seems to be quite useful as it helps to compare various scenarios. One way to do this is by using a baseline scenario, which assumes that no change has been made to the WIP or workforce. After creating a change within the app, the user can then run another scenario and compare the outcomes with the baseline scenario. This gives a clear idea of what works best for the day and helps in making the right decisions.
Previous Work
- Identified future bottlenecks both primary, secondary, and tertiary.
- Identified future storage problems within the facility.
- Predict throughput for the next five years based on yearly induction rates.
- Determined Average flow days per part.
- Identified future bottlenecks both primary, secondary, and tertiary.
- Determined the average distance a part travels during refurbishment.
- Planned ways to reduce large queue sizes.
- Predicted weekly throughput for production meetings
- Identified cost per station and for part.
Plant Simulation Experience
- Different parts can be accounted for in the model and routed differently depending on their type.
- ID systems are created for when parts must be disassembled and reassembled on the same item.
- Gantry loaders, carts, and people can be used to transport parts around a facility on predetermined pathways.
- If the line already has parts in the system, the model can be preloaded to reflect that. (This provides short-term results)
- A multiprocess loop system was enacted if parts are required to go to the same station multiple times.
- Certain parts can be priortized to go through a station before others.
Benefits of MRO Simulation Models
- Primary, secondary, and tertiary
- Quantify performance improvement
- Scenarios comparisons -what-if analysis
- Model process chnages
- Optimization to goal
- Gantry loaders, carts, and people can be used to transport parts around a facility on predetermined pathways.
- The average distance a part moves can be calculated once the modes of transportation are set.
- To improve productivity, the user can view the worker OEE either as a whole or by selecting a specific worker. By doing so, the user can identify workers who may have less work to do and move them to stations where there is more work that needs to be completed.
- To optimize the production process and increase efficiency, it’s important to take a look at the equipment OEE as a whole and by station. By doing so, the user can identify stations with higher equipment OEE and move workers to those stations to ensure that they are being utilized to their full potential.
- Cost can be applied in the model to determine the cost of a station or part.
